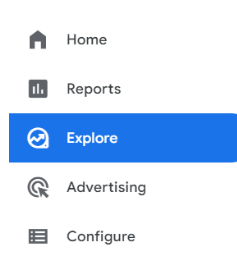
In our last article we covered Google Analytics Reports and how they’ve evolved from UA. Here, we’ll be heading to the next option in the left-hand navigation, Explore. Building on the popular Custom Reports functionality in Universal Analytics (UA), Google Analytics 4 offers a more advanced and user-friendly way to deep-dive into your data using Explorations.

The Explore section in GA4 offers new ways to interpret and analyse your website data. Its intuitive interface offers more data visualisation options than its predecessor, making it easier to bring more of your data to life. If you’re familiar with UA, some of these new options will feel somewhat familiar, such as the Funnel exploration, which offers a more configurable version of UA’s Funnel Visualisation report. Surface-level similarities aside, GA4 offers far greater levels of flexibility and customisation – though the new format of Explorations may feel daunting to some. So, we’ll be taking a whistle-stop tour of the Explore tab, the various types of explorations available to you and how to get started.
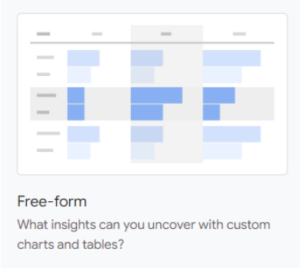
Free-form Exploration
The first type of exploration is based on using simple charts and tables. The free-form technique is one of the simplest and most flexible options in GA4, essentially allowing you to build out a dynamic custom report based on any dimensions, metrics and filters you like. Google Analytics answer to the humble pivot table, this tool is great for any users looking to get started with explorations, as you can gradually increase the complexity of your insights over time.
Use for: deep-diving into your website data if you aren’t sure how to visualise the results or for open-ended querying of your data set.
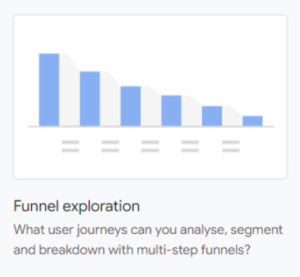
Funnel Exploration
This allows you to create a visual representation of the steps that users take on your website or app as they move towards a specific goal or conversion. This type of visualisation isn’t new to the Google Analytics suite, but the ability to manipulate each stage of the funnel with your chosen events gives GA4’s innovation a powerful advantage.
Funnel exploration is particularly useful for e-commerce businesses, as you can easily understand how many browsers add your products to their baskets and continue through to checkout. By identifying any poor conversion points in the process, you can focus on improving the user experience and focus conversion rate optimisation efforts.
Use for: understanding how well your website or app is performing in terms of achieving specific goals and conversion events whilst identifying areas of the user journey that may need improvement.
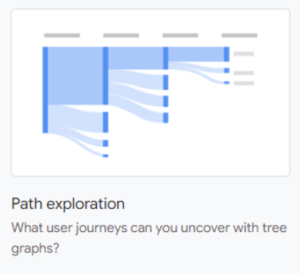
Path Exploration
Similarly to the Funnel exploration, the Path technique allows deeper analysis of user journeys. First introduced in UA’s Behaviour Flow report, this type of tree graph visualisation may be familiar to seasoned Google Analytics users.
Path exploration allows you to examine onward paths from any configured events or page titles on your site. In doing so, you can gain deeper insights into where users are going after specific actions and vice versa. This technique has many of the same benefits as the Funnel exploration above, but with the added benefit of being able to see exactly where users go and/or any successive actions they take.
Use for: understanding how users are navigating through your site content and learn how different pages and events relate to each other.
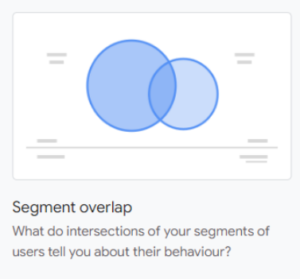
Segment Overlap
In GA4, segments are customisable groups of users who share characteristics or behaviours, this can be broad demographic characteristics such as age, through to more detailed custom options, such as users who have purchased something from your site. This technique allows you to compare the overlap between up to three segments.
By comparing the overlap between segments, you may be able to unlock insights into how different types of users behave on your site and how they’re potentially interlinked with one another. For example, you may wish to measure and understand the overlap between new site visitors and shopping basket abandoners.
GA4 also offers a powerful new feature that allows you to select the above overlap and from it, build out a new custom audience which could be used later in other explorations or even in remarketing campaigns in Google Ads.
Use for: analysing the impact of your site and marketing efforts on specific groups of users and building new audiences for future insights and use in advertising.
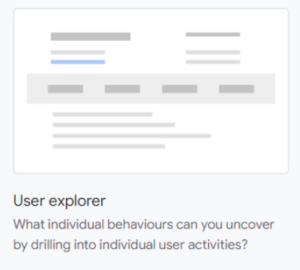
User Explorer
This technique takes your analysis to the most granular level, by allowing you to observe individual user behaviour. This is quite different from other explorations where user data is viewed at an aggregated level. At first, this might not seem as actionable as the other techniques, but there are some specific cases where this approach is helpful.
A key benefit is that you can more closely examine unusual behaviour. For example, if you noticed that sales of a specific product were extremely high in one country relative to others you could compare individual user journeys by location to uncover key differences. You can then try to replicate any findings in underperforming regions.
Use for: drilling down from aggregated user journey data to an individual level to get a more detailed understanding of behaviour.
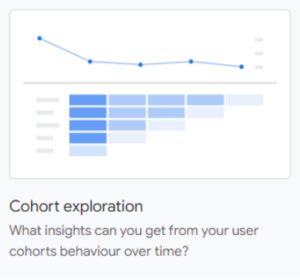
Cohort Exploration
This exploration is slightly more complex, but can be useful in certain applications. It allows you to analyse the behaviour of groups of users who have completed a common event on your site. Such an event could be the date users first visited the site, which Google labels First touch (acquisition date). You can then specify a return criteria, such as transactions, to understand week-over-week how many of the initial cohort went on to convert each week from their first session.
Use for: breaking down actions of users over time, all of whom have previously taken a specific action on your site
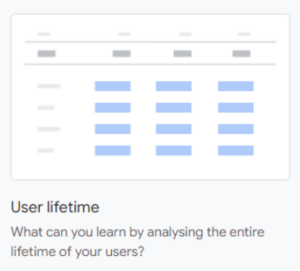
User lifetime
This exploration is particularly useful for e-commerce sites that generate frequent repeat sales. By looking at how users have behaved since their first visit, you’re able to gain insight into the overall lifetime values of visitors. This can help determine which of your marketing activities is not only generating revenue by month or year, but also driving long term recurring revenue from users.
Additionally, as we covered in this article, GA4 offers powerful machine learning capabilities, which in this instance can be used to tell you which campaigns are driving users with the highest predicted revenue over time. This is useful for larger retailers when making decisions on where to spend their marketing resources.
Use for: gaining insights into users entire history on your site, including their previous and predicted conversion events
Further Support
At Door4, our aim is to make your transition to GA4 as straight-forward as possible. So, if you need any help or advice on building custom explorations, interpreting GA4 data, or ensuring your setup is correct and measuring accurately.
Start the conversation today