If you’ve logged into Google Analytics 4 (GA4), one of the first things you may have noticed is its streamlined interface and the disappearance of the familiar ready-made reports we’ve come to know and love in Universal Analytics (UA).
From the infrequent dabblers to the daily experts, Google Analytics users have spent many years getting comfortable with UA. It’s no surprise then, that the strange new world of GA4 has been met with a certain degree of apprehension and confusion.
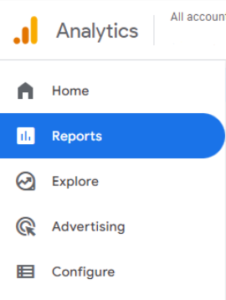
Despite some visual similarities between the two platforms, clicking through the left-hand navigation no longer returns the usual extensive list of pre-configured reports. Instead you’re met with just a few options, such as Reports, Explore and Advertising. Since UA is primarily report-based, we’ll be taking a look into the Reports section here, to understand what’s changed between UA and GA4.
Find out more about the GA4 Explore section here.

Whilst some reports are included out of the box in GA4, these often don’t present the same data or level of detail that you may be used to seeing in UA. This can make new users feel like they need to work twice as hard to find the same information available in UA. Unfortunately, this may be the case – but only to begin with. Luckily, GA4 comes with powerful new reporting functionality that allows you to customise and save reports. So, if you’re after a like-for-like UA report in GA4, you may have to take a deep-dive into these settings.
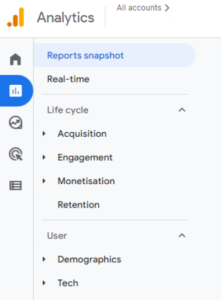
Where reports make up the bulk of the navigation options in UA, these have now been condensed into just one Reports section in GA4. Clicking into this option takes you to the Reports snapshot overview report, a high-level dashboard that draws on key components from all the default reports. Below this, you’ll find the Real-time report, which is a similar idea but shows data from the last 30 minutes. Further still, you start to find other reports organised into groupings and subgroupings – it may sound daunting, but don’t worry, here’s a quick overview to help you get your bearings.
Collections
The highest tier of organisation when it comes to reports is what GA4 calls Collections. This isn’t immediately evident when exploring the Reports section, but the two pre-defined Collections are Life cycle and User. Collections are then used to house Topics and subsequent Reports.
Topics
This second-tier of the GA4 reporting world serves to group reports within distinct topics or categories. Examples of such topics include Acquisition and Engagement within the Life cycle collection; and Demographics and Tech within the User collection.
Reports
At the most granular level, GA4 distinguishes between two types of report: Overview reports and Detail reports. Overview reports offer a broader dashboard-type view, displaying all the key metrics on a specific area. For example, the Acquisition overview report presents various tables and charts about user sessions and the various channels through which they ended up on your site. This is great if you want to know user volumes by date or which channels are bringing the lion’s share of new users to your site.
However, if you want to understand exactly how many users came through each channel and how they engaged with your site, you’ll need the User acquisition report – a Detail report within the Acquisition topic grouping.
Customising Reports in GA4
Hopefully you’re now a little clearer on the anatomy of Reports in GA4. What’s important (and exciting!) to know about the above structure, is that it’s almost completely customisable. GA4 allows you to create, rearrange and modify Collections, Topics and Reports so that you can quickly retrieve the information that really matters to you and your business.
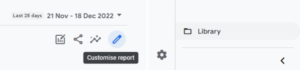
Editing a report is easy, and can be done by selecting Customise report in the top right-hand corner of the screen, just below the date selector. At the bottom of the left-hand navigation you’ll find the Library – a convenient central location for you to store and manage all of your customised reports. In there, you’ll find all the default reports from the navigation, which you can also customise to your requirements. You can also use any of these default reports as a template from which to build your own bespoke reports.
Beyond Reports
UA does have a Custom Reports functionality, which differs slightly from the above in that it’s more like a sandbox environment for you to build a reporting view from the ground up. This has been advanced in GA4 with the introduction of the Explore tab. Here you can create your own Explorations from scratch or based on templates which feel vaguely reminiscent of some reports from UA. For example, GA4’s Path exploration is a more refined and flexible version of the Behaviour Flow report in UA, a popular tree graph report detailing user journeys through your site.
To learn more about Explorations, check out our article on understanding the various options available to you in the Explore tab
Further Support
At Door4, we’re on hand to make your transition to GA4 as simple and stress-free as possible. So, if you need any help or advice on setting up reports, replicating UA reports in GA4, or ensuring your setup is correct and measuring accurately.
Start the conversation today