


01.11.2021|
Why is statistical significance important for CRO? | Learn more about A/B test length and data interpretation to boost conversions
For any user analyst, the Enhanced E-commerce features within Google Analytics; Shopping and Checkout behaviour, in particular, would have been your go-to. These can be micro-conversion events that lead to the macro-conversion event: a purchase.
We have discussed how the reports differ between GA4 and UA and how to get comfortable with GA4 Explorations, allowing you to build custom reports on the fly based on your event data.
Funnel reports in Google Analytics 4 are a great improvement to Universal Analytics and allow you to see the steps your user takes to complete a desired task. In this example, we will show you how to set up a basic shopping behaviour funnel to show how users behave while purchasing a product.
However, if your website is lead generation, with GA4, you can now set up a similar Funnel exploration to track the path a user takes to convert and identify drop-offs that may require further investigation to improve user experience.
To configure a basic shopping funnel, log in to your GA4 property and use the left sidebar to click ‘Explore’.
Then, click on the ‘Funnel Exploration’ template to gain a visualisation of the steps your users take on your website to convert. The screen will be divided into three columns: ‘Variables’, ‘Tab settings’ and ‘Exploration’.
This left column is where you choose the data that you intend to use for your report, including the dimensions, metrics and segments for your exploration. If you want to use some segments or dimensions within your report, they must be included in this column. However, you can edit and add missing or new data later on.

To compare different groups of your website users and how they behave, you should include these segments here. For example, this could be website users that have been served a specific variant of a CRO test.
You can create your own custom segment based on user criteria, session data or events – alternatively, you can choose a suggested segment, such as recently active users, purchasers or non-purchasers.
User segments
Groups of users who engage with your site or app. E.g. Users who added a product to their basket but did not purchase.
Session segments
Groups of the sessions that occurred on your site or app. E.g. Sessions from the same advertising campaign.
Event segments
Groups of events that were triggered on your site or app. E.g. All generate_lead events that occurred on a specific device.

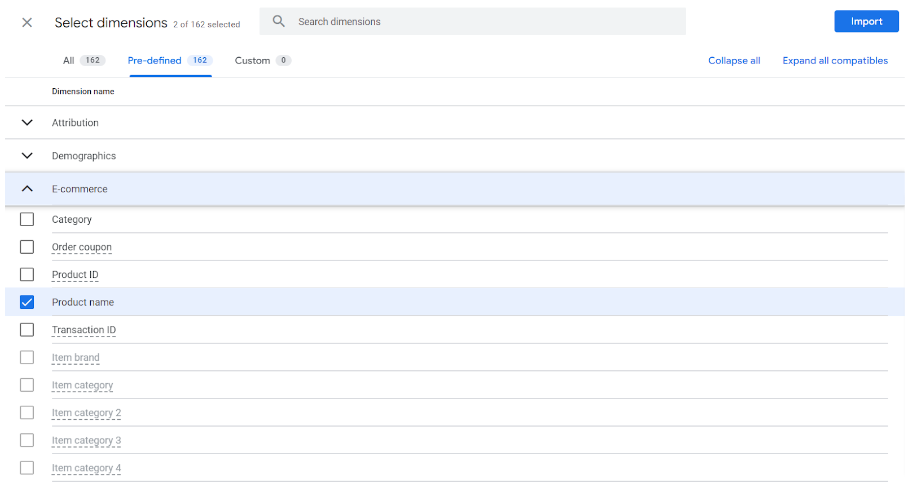
Attributes that describe your data, used a text rather than a number, they are the parameters of an event, product, transaction or user, for example:
To add a dimension to the variables column, click the plus icon and then select the metrics and dimensions you need and click import.
This is where you configure what the report will look like.
Using the drop-down menu to select the exploration method to visualise the data, in this example, we are looking at the ‘Funnel exploration’.

‘Standard funnel’ (stepped)is probably most familiar to you, it is the bar chart from the ‘Shopping behaviour’ page in Universal Analytics, showing how many users complete each step of the funnel and what the drop-off is.
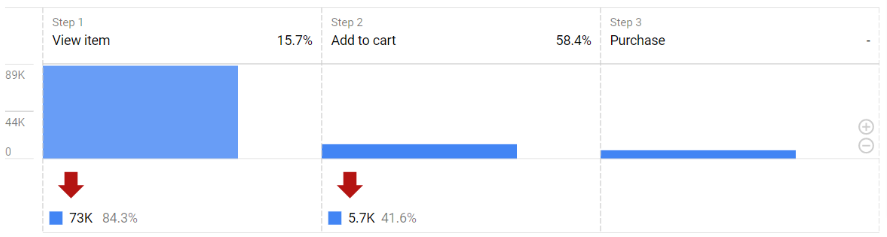
Standard funnel
There are some disadvantages to this visualisation; it is difficult to understand the performance of the funnel over time. Which is where the ‘Trended funnel’ (trend line) is useful.
 Trended funnel
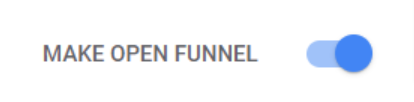
As default, GA4 Funnels are closed, meaning if a user enters the funnel at a later step, they will not be included in the funnel. Alternatively, if a user enters the funnel at the first step and skips the second step, then completes the third step, the drop-off will be shown after step one meaning that the last step would not be counted.
To enable your visitors to enter the funnel at any step, click on the ‘Make open funnel’ toggle.
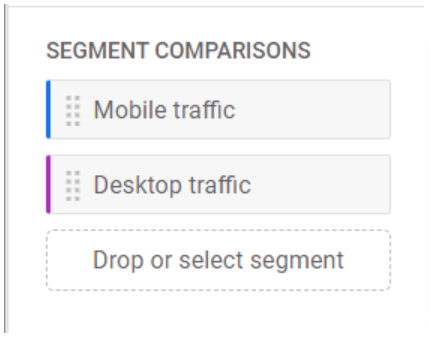
Here, you can add four segments that you have already included within the ‘Segments’ of the ‘Variables’ column.
You can add these by dragging them across from the ‘Variables’ tab, you can also click and select your segment in the ‘Segment Comparisons’ box and they will be added to your Funnel exploration.
This is the main part of the Funnel exploration report, if you already have some predetermined, you can delete them. To add new steps, click the pencil icon to open the editing interface.

You can label each step as you configure the conditions. You can add one or more conditions that your users must meet to be included in that step of the funnel journey and select from dimensions that are available by default or events you have already set up.

If you wish to narrow the users down further, you can do so by defining the parameters using the ‘AND’ and ‘OR’ buttons.
You can now select if you would like this step to directly or indirectly follow the previous step, we would recommend indirectly. In addition, you can select the maximum time difference between both steps.

Once you click apply, you will be able to see your funnel – the micro conversion events that result in the macro conversion.
You can select a predetermined dimension to provide the breakdown data series for your funnel report, which you can break down by device category, gender, country and so on.
You can add these by dragging them across from the ‘Dimensions’ tab, you can also click and select your dimension in the ‘Breakdown’ box and they will be added to your Funnel exploration.

You can also apply filters to restrict data shown in the analysis according to set conditions provided. To apply this, click on ‘Filters’ in the tab settings and select the dimension or metric you want to filter the data by.

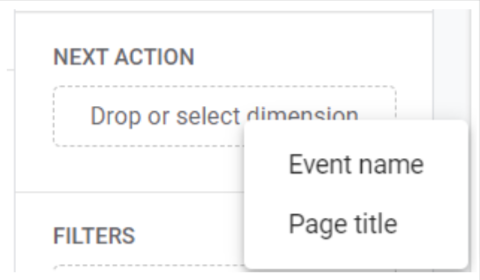
You can also choose a dimension to show the most common user interactions that follow a funnel step. To do this, click on ‘Next action’ under ‘Tab settings’ and select the next action from your list of pre-selected dimensions, such as screen name or event name.
Now, if you hover your cursor over any of the steps in the ‘Funnel exploration’ tab, you will be able to see the next actions a user takes in the pop up.

This tab is where you can see your data, based on the configuration in the variables tab and tab settings and have successfully completed your funnel report.

When the report is generated, you can interact further and deep-dive into the data, for example, you can right-click on any bar in the chart to create a segment from these users or you can view them in the User Explorer report.
To make informed, data-led decisions that will make a positive impact on your CRO experimentation programme, it is essential that marketers understand Google Analytics 4 and how to leverage these changes into insights. Analytics can only provide a part of the picture of your users (what they are doing on the site), to be able to dive deeper into why users are behaving a certain way it is recommended to use additional tools to analyse user behaviour and attitudes.
At Door4, we’re on hand to make your transition to GA4 as simple and stress-free as possible. So, if you need any help or advice on GA4 and CRO, or ensuring your setup is correct and measuring accurately, start the conversation today.


Our latest articles, features and ramblings.
We explore performance marketing, AI, communications and optimisation.